I. The Numbers Tell the Story
A. Divorce Statistics and Trends – Definition and Scope of Divorce
In Canada, understanding divorce statistics and trends is essential for policymakers, legal professionals, family therapists, and the general public. Divorce is the legal dissolution of a marriage, a process that has evolved over time to reflect changes in societal norms, legal frameworks, and individual behaviors.
B. Emphasis on Statistical Analysis and Visualizations
In a world driven by data, statistical analysis provides valuable insights into complex phenomena like divorce. By examining numbers, we can uncover patterns, correlations, and trends that might otherwise remain hidden. The visualizations presented below provide graphic representations to more clearly reflect developing trends.
C. Overview of Data Sources (Statistics Canada)
The statistics and insights presented in this article are sourced from Statistics Canada. The specific URLs for the data sources are cited, to the extent available. These sources provide a solid foundation for the analysis, ensuring that the information is accurate, relevant, and up-to-date.
II. The Statistics & Graphs
A. Overview of Number of Divorces from 1970 to 2020
Divorce rates in Canada have experienced fluctuations over the past five decades. From the 1970s to the present, changes in societal attitudes, legal frameworks, and economic conditions have influenced the dynamics of marriage and divorce. The data from Statistics Canada provides a comprehensive view of these trends, allowing us to explore the underlying factors and patterns.
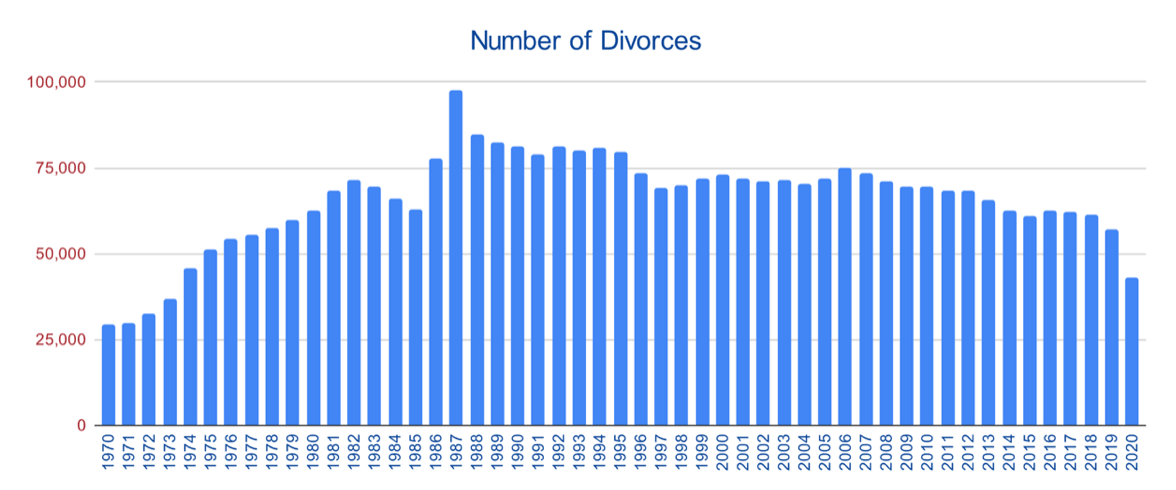
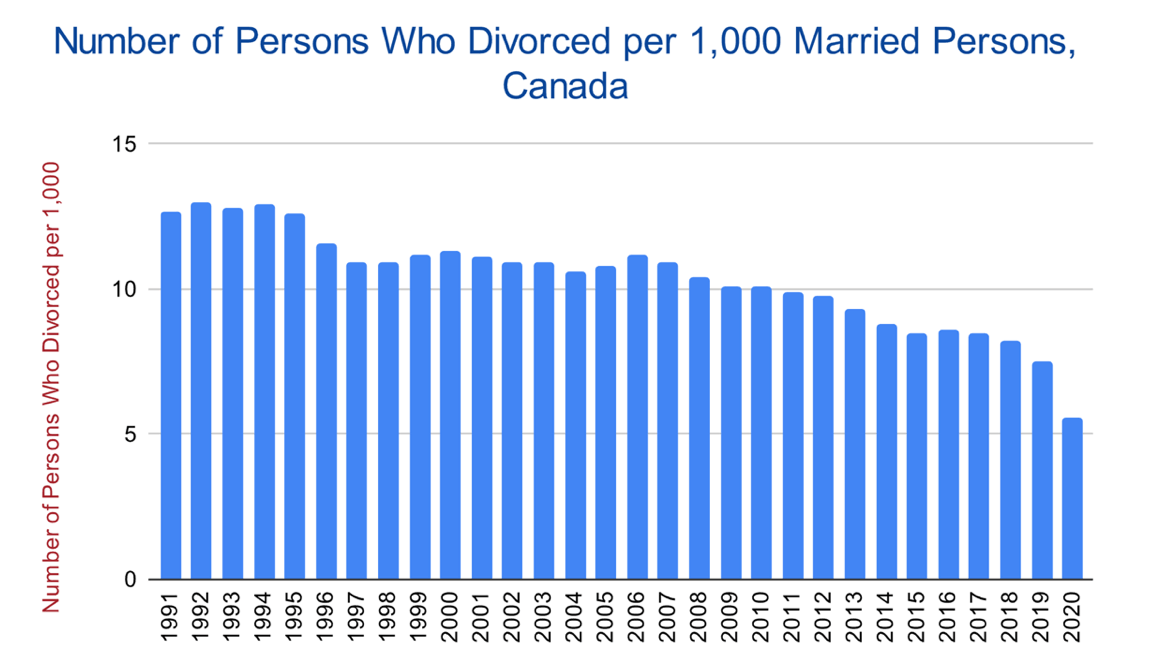
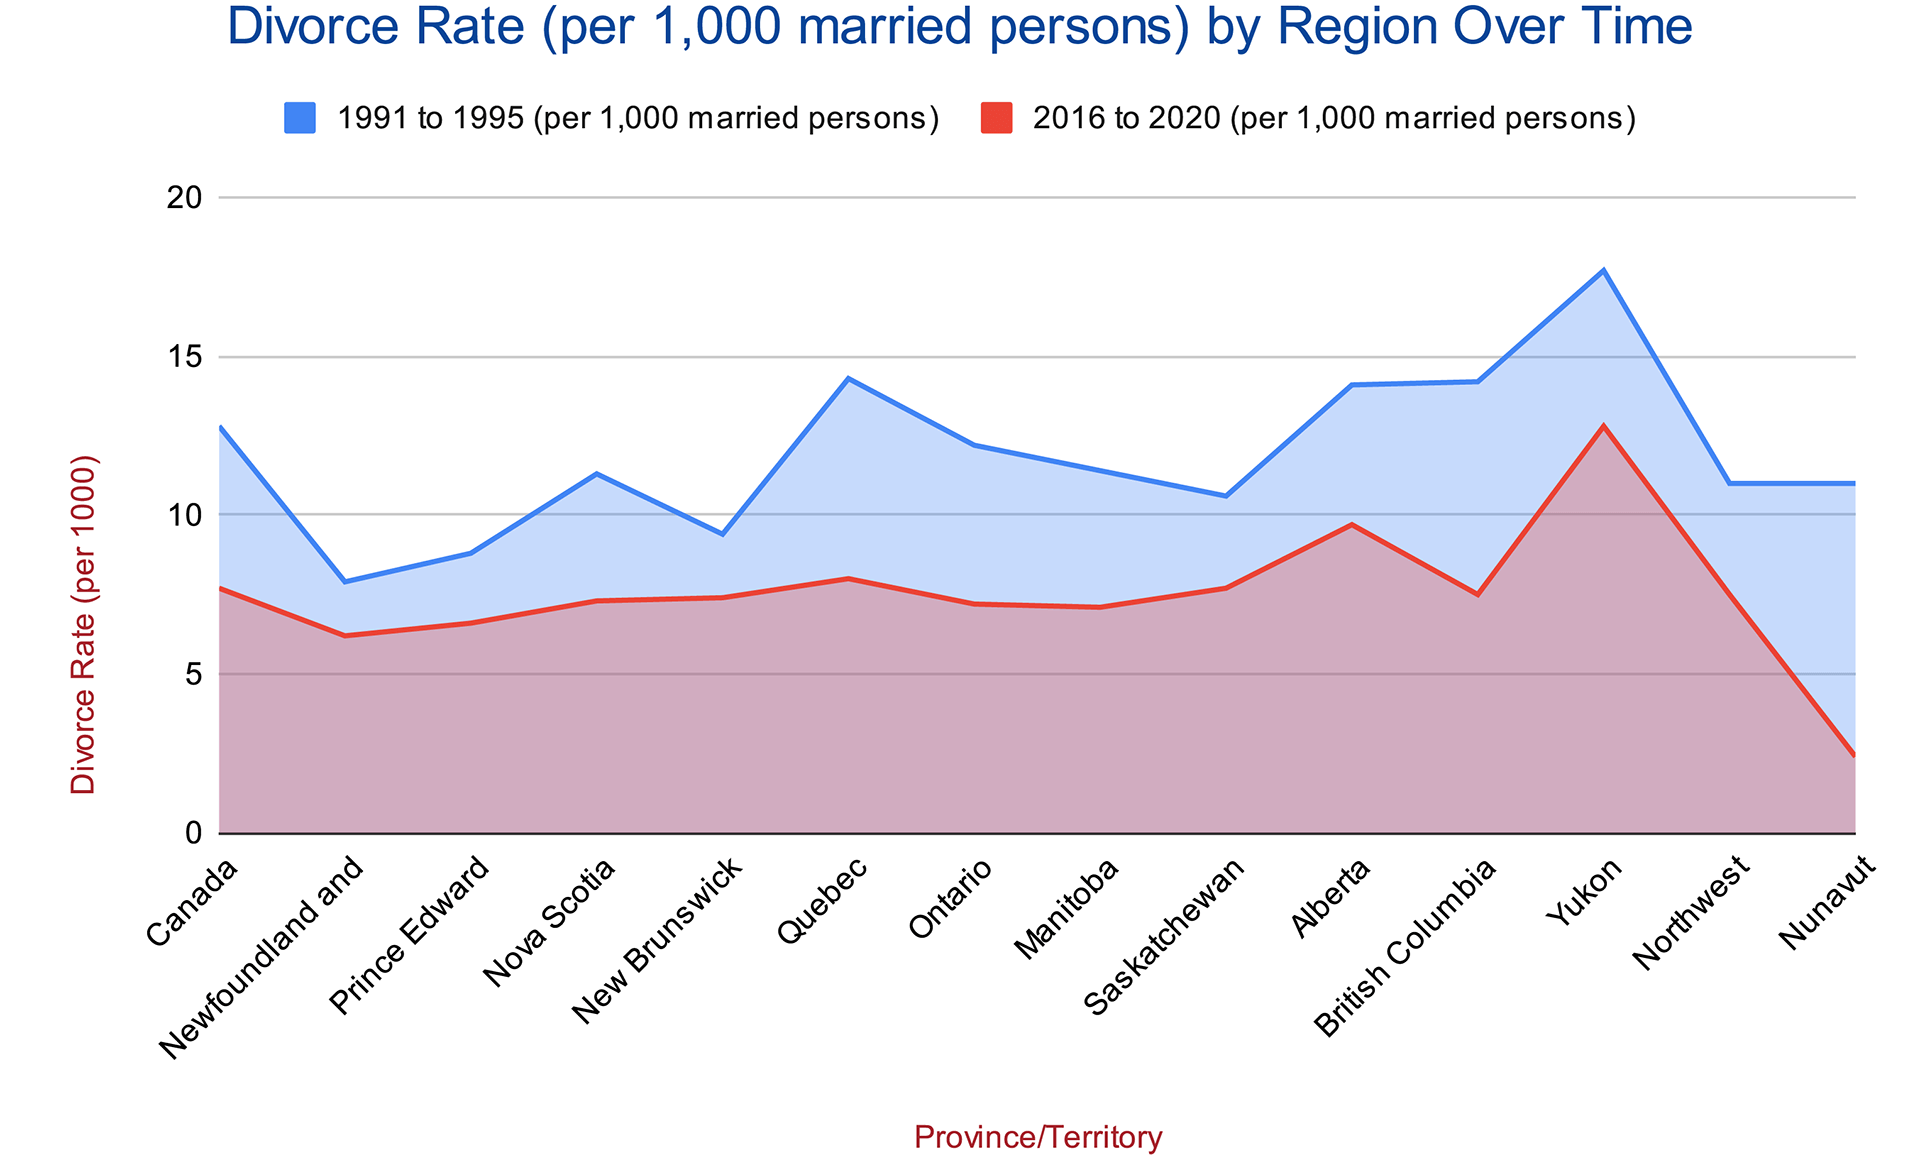
The first of the bar graphs above reflects the actual number of divorces in Canada over time, whereas the second bar graph reflects the divorce rate (per 1,000 married persons) over time.
Divorce rates are not presented before 1991 because estimates of the married population included people in common-law unions before that year.
The visualization above reveals several key insights:
- Steady Increase in the 1970s and 1980s: The number of divorces increased steadily during this period, reflecting changes in divorce laws and shifting societal norms.
- Reform of Divorce Act (Canada): The number of divorces in Canada peaked following the reform of the Divorce Act (Canada) in 1985.
Additional Observations and Insights: Based upon the data, Statistics Canada has concluded that:
- Decrease in Divorce Rates: The divorce rate has been steadily declining over the last three decades, from 12.7 per 1,000 married persons in 1991 to 5.6 per 1,000 in 2020.
- Population at Risk: This decline has occurred despite an increase in the population at risk of divorce, i.e., married persons.
- Societal Changes: Two key societal changes have contributed to this decline:
- Aging Married Population: The married population is getting older due to general population aging and younger generations opting for common-law unions.
- Lowered Tendency Among Young Adults: Younger married adults are less likely to divorce compared to previous generations.
- Age-Specific Rates: Divorce rates are generally lower among older adults, contributing to the overall decline.
- Selectivity of Marriage: Fewer people are choosing to marry, and those who do are more likely to have characteristics that favor a long-lasting marriage.
- Global Trend: This decrease in divorce rates is not just limited to Canada but is also observed in other countries.
B. Steady Rise in the Average Age at Divorce, Mean Age or Mean Duration In Years, Canada
Observations and Insights: Based upon the data, Statistics Canada has concluded that:
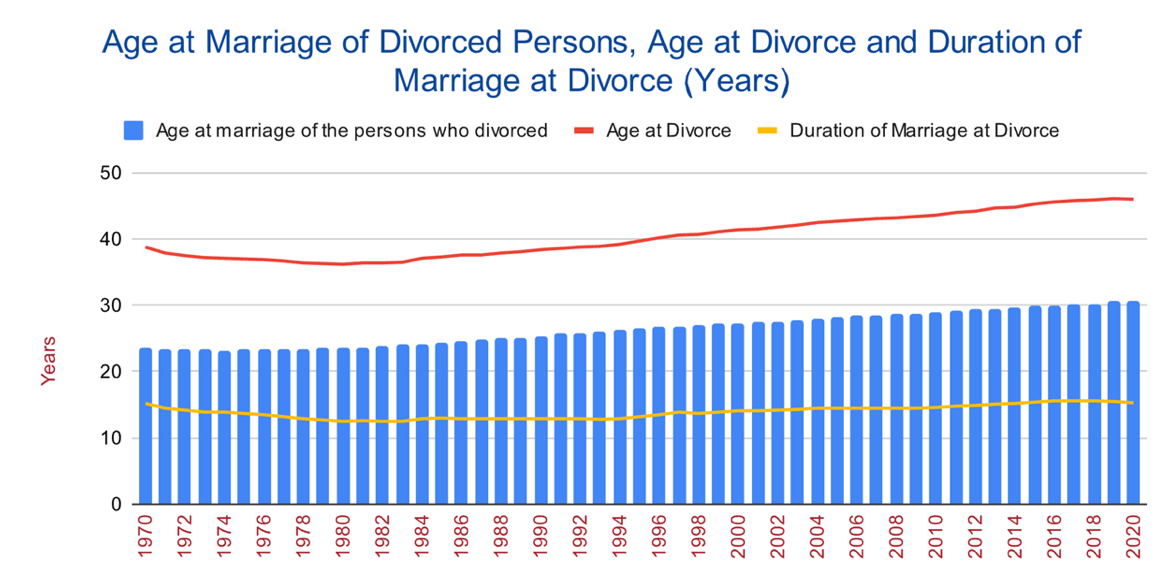
- Rising Average Age at Divorce: The average age at which people divorce has been increasing, from 36.2 years in 1980 to around 46 years more recently.
- Factors for Age Increase:
- Higher Age at Marriage: The average age at marriage for those who end up divorcing has increased from 23.7 years in 1980 to 30.7 years in 2020.
- Longer Marriage Duration: Marriages that end in divorce now last longer, with the average duration increasing from 12.5 years in 1980 to 15.3 years in 2020.
- Gender Differences:
- Women generally marry and divorce at younger ages than men.
- In 2017, the average age at divorce was 44.5 years for women and 47.0 years for men.
C. Divorce Rate by Age Over Time
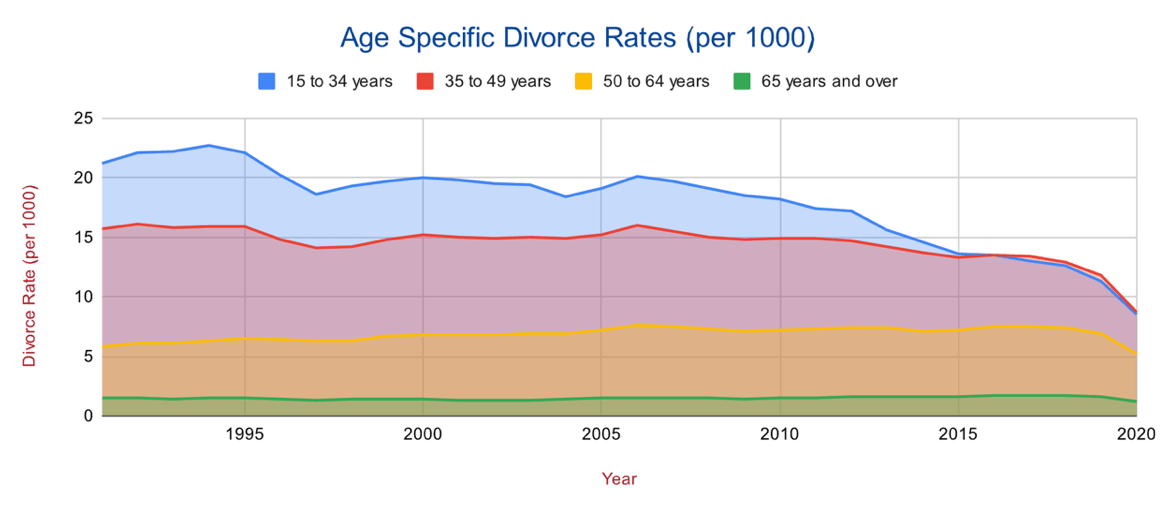
In the past three decades, divorce rates (per 1,000 married persons) among younger adults have declined, while there’s been a slight increase for older adults. Across all age groups in Canada, a drop in the number of divorces per 1,000 married individuals was noted in 2020, likely due to the pandemic.
Age Group Analysis
| Age Group | Observations |
|---|---|
| 15 to 34 years | Divorce rate started at 21.2 in 1991 and dropped to 8.5 in 2020. Notable decline, especially in recent years. |
| 35 to 49 years | Divorce rate started at 15.7 in 1991 and dropped to 8.7 in 2020. Consistent decline but less drastic compared to the 15-34 age group. |
| 50 to 64 years | Divorce rate started at 5.8 in 1991 and dropped to 5.2 in 2020. Generally increased until mid-2010s, then started to decline. |
| 65 years and over | Divorce rate started at 1.5 in 1991 and dropped to 1.2 in 2020. Slight increase until the mid-2010s, then a decline. |
Implications:
- The decline in younger age groups could be due to later marriages or changing societal norms.
- The slight increase in older age groups might be attributed to “gray divorce” phenomena, where longer life expectancies and different life priorities lead to late-life divorces.
D. Mean and Median Duration of Marriages (Yrs) Over Time
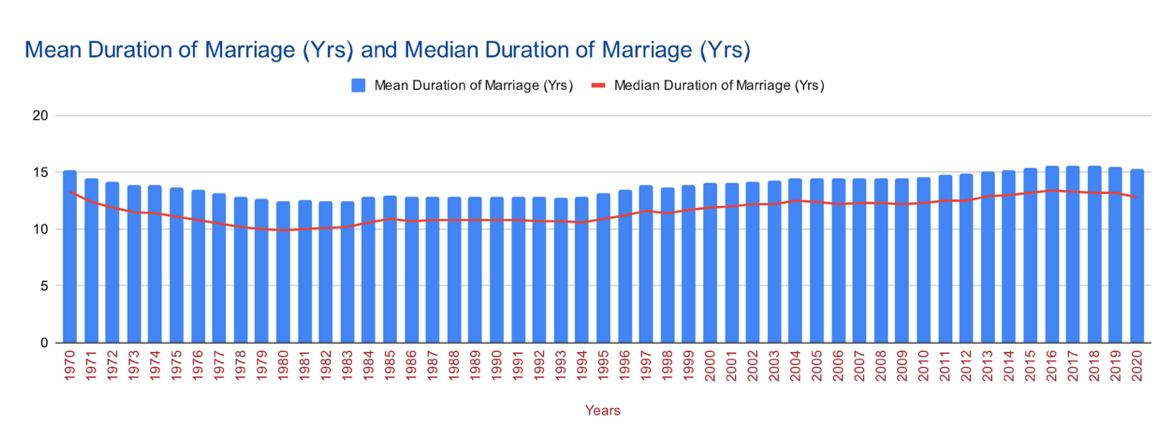
Overall Trends:
- Mean Duration: The mean duration of marriage has generally increased over the years, from 14.5 years in 1970 to 15.3 years in 2020.
- Median Duration: The median duration of marriage also shows a decrease, albeit with some fluctuations, from 13.3 years in 1970 to 12.8 years in 2020.
Decade-wise Analysis:
| Decades | Mean Duration Analysis | Median Duration Analysis |
|---|---|---|
| 1970s | Started at 14.5 years and declined to 12.5 years. | Started at 13.3 years and declined to 10 years. |
| 1980s | Remained relatively stable around 12.9 years. | Slight increase from 10.1 years to 10.8 years. |
| 1990s | Increased from 12.8 years to 14.1 years. | Increased from 10.7 years to 11.9 years. |
| 2000s | Remained stable around 14.5 years. | Slight increase from 12 years to 12.3 years. |
| 2010s | Increased from 14.6 years to 15.6 years. | Increased from 12.3 years to 13.4 years. |
| 2020 | Slight decrease to 15.3 years. | Decrease to 12.8 years. |
Key Observations:
- Stability in the ’80s: Both mean and median durations remained relatively stable during the 1980s.
- Increase in the ’90s and 2010s: Both mean and median durations saw significant increases in the 1990s and 2010s.
- Stagnation in the 2000s: The 2000s saw a period of stability with little change in both mean and median durations.
- Recent Decline: Both mean and median durations saw a slight decline in 2020, possibly due to the impact of the pandemic.
Implications:
- Longer Marriages: The general trend of increasing mean and median durations suggests that marriages are lasting longer over the years.
- Societal Shifts: The changes in durations may reflect societal attitudes towards marriage and divorce, with a trend towards longer-lasting marriages.
- Pandemic Impact: The slight decline in 2020 could be an anomaly due to the COVID-19 pandemic affecting marital stability.
E. Duration of Marriage
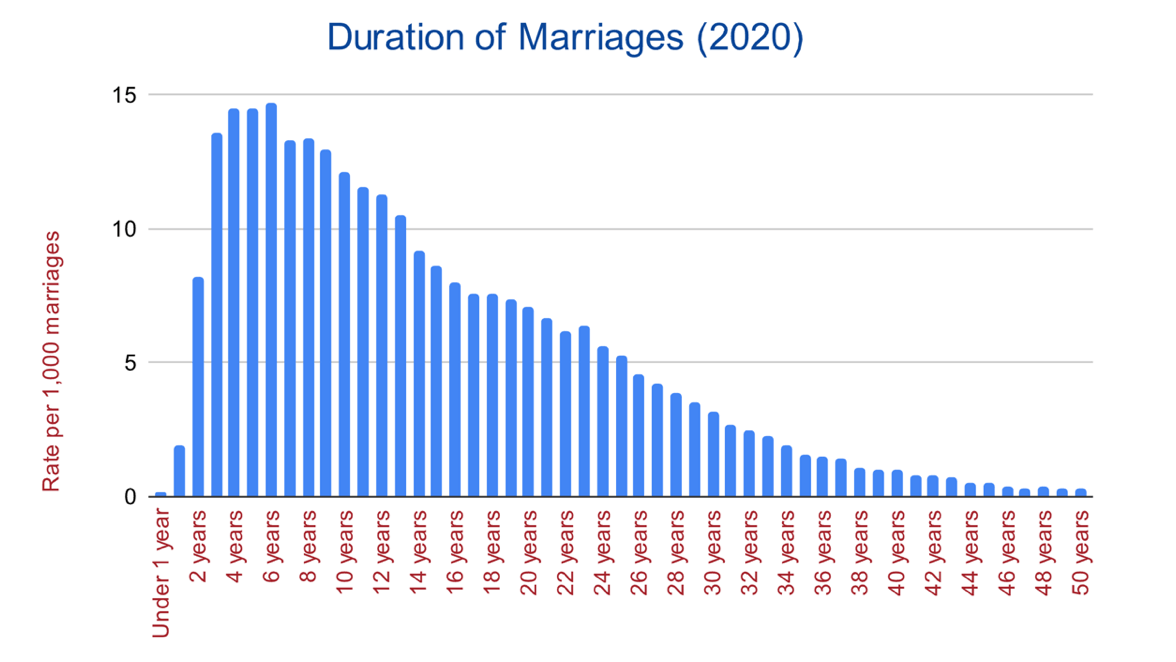
Overall Trend: As at 2020, the rate of divorce decreases as the duration of marriage increases, indicating that longer marriages are generally more stable.
Duration of Marriage Analysis
| Duration of Marriage | Analysis |
|---|---|
| Under 5 Years | Highest divorce rates occur within the first 5 years of marriage, peaking at 15 divorces per 1,000 marriages at 4 and 5 years. |
| 5 to 10 Years | Divorce rates remain relatively stable, hovering around 13 to 15 divorces per 1,000 marriages. |
| 11 to 20 Years | A gradual decline in divorce rates is observed, going from 12 divorces per 1,000 marriages at 11 years to 7 at 20 years. |
| 21 to 30 Years | Further decline of divorce rates, dropping from 7 divorces per 1,000 marriages at 21 years to 3.2 at 30 years. |
| 31 to 40 Years | Divorce rates continue to decrease, reaching as low as 1 divorce per 1,000 marriages at 39 and 40 years. |
| 41 to 50 Years | Extremely low divorce rates, ranging from 0.8 to 0.3 divorces per 1,000 marriages. |
Implications:
- Early Marriage Vulnerability: Marriages are most vulnerable to divorce in the initial years, especially within the first 5 years.
- Mid-Marriage Stability: After the 10-year mark, marriages tend to be more stable, as indicated by the declining divorce rates.
- Long-Term Resilience: Marriages that last over 30 years are highly resilient, with very low divorce rates.
Societal Considerations:
- The data aligns with societal trends of couples marrying later and the average age at divorce increasing, as longer marriages are generally more stable.
- The data may also reflect changing societal norms and attitudes towards marriage and divorce, especially in long-term relationships.
Pandemic Impact:
- No specific data on the impact of the pandemic on these rates, but it’s likely that the overall decrease in divorce rates in 2020 affected these numbers as well.
F. Marital Status – Married and Common Law
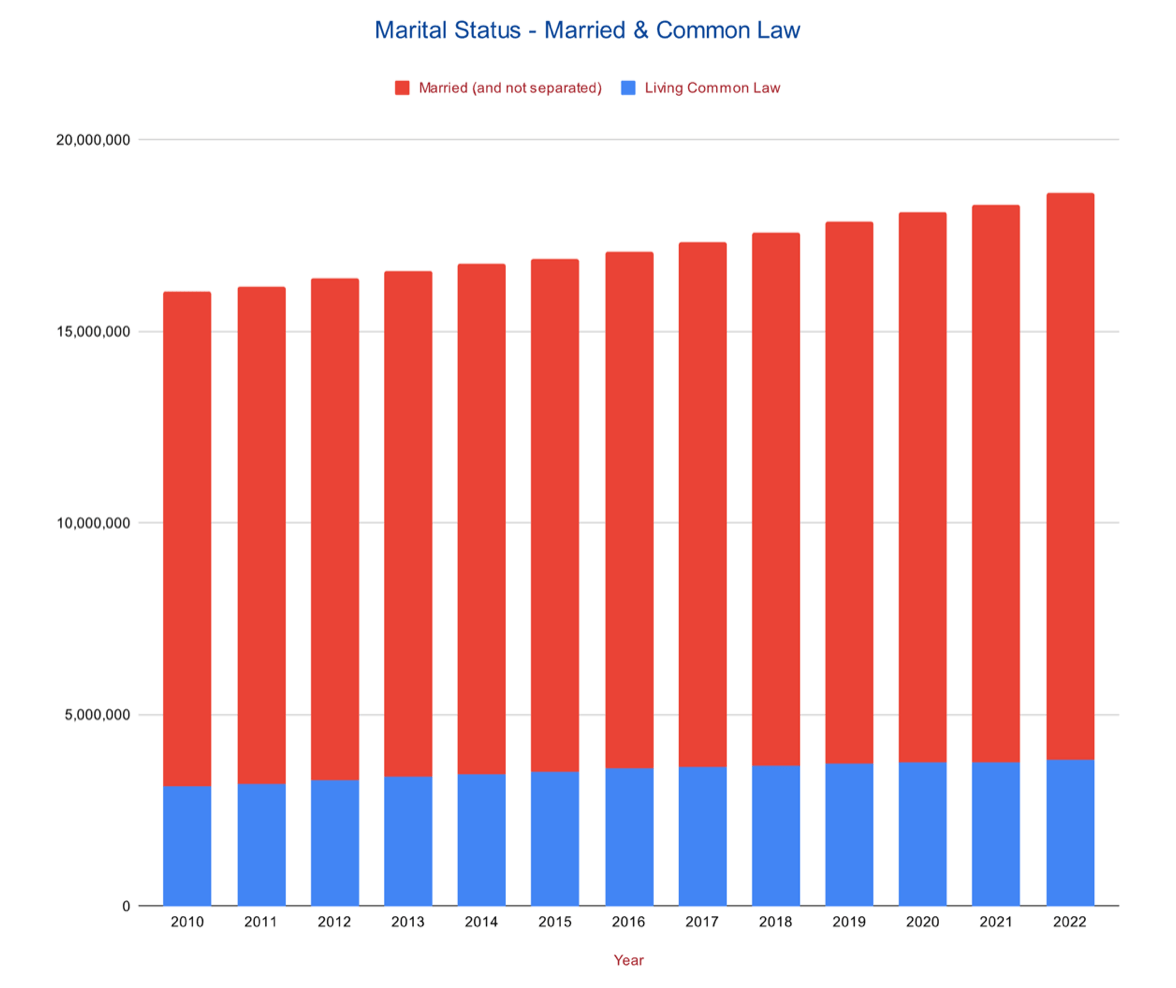
Overall Trends:
- Married Population: Increased from 12,911,803 in 2010 to 14,805,954 in 2022.
- Common-Law Population: Increased from 3,127,325 in 2010 to 3,821,716 in 2022.
Yearly Analysis
| Categories | 2010 | 2015 | 2020 | 2022 | Observations |
|---|---|---|---|---|---|
| Married | 12,911,803 | 13,387,306 | 14,360,073 | 14,805,954 | Consistent increase |
| Living Common Law | 3,127,325 | 3,518,915 | 3,745,644 | 3,821,716 | Steady increase |
Comparative Observations:
- Growth Rate: The married population has grown by approximately 14.7% from 2010 to 2022, while the common-law population has grown by about 22.2% in the same period.
- Stability vs. Flexibility: The more consistent growth in the married population suggests a level of stability, whereas the higher growth rate in the common-law population may indicate a societal shift towards more flexible forms of partnership.
- Social Norms: The steady increase in both categories reflects evolving social norms, with a notable uptick in common-law relationships.
Implications:
- Marriage Stability: The consistent growth in the married population suggests increased marriage rates and/or more stable existing marriages.
- Changing Social Norms: The faster growth rate in common-law relationships indicates a societal shift in attitudes towards less traditional forms of union.
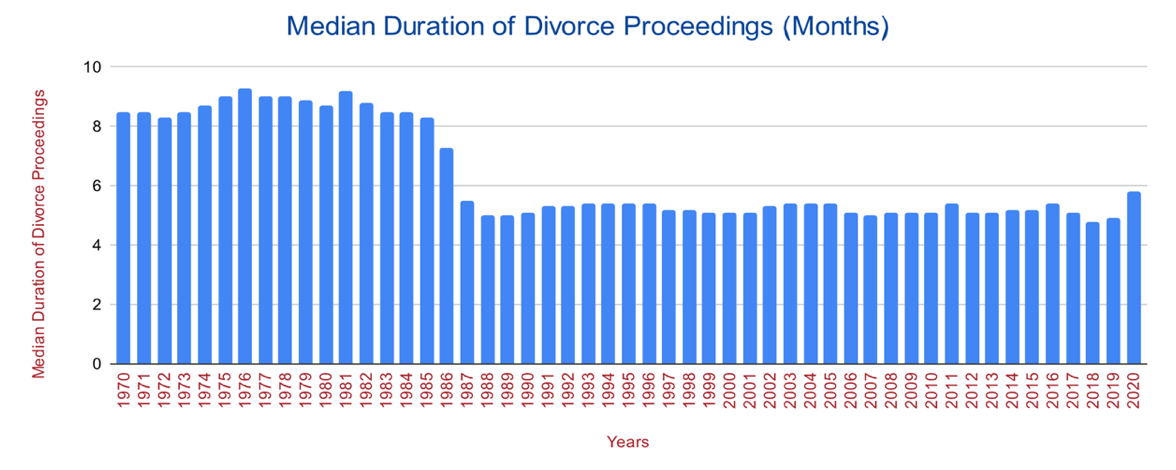
G. Median Duration of Divorce Proceedings (Months)
The duration of divorce proceedings is defined here as the number of months between the date on which the divorce application was filed and the date on which the divorce was granted (that is, when it becomes effective).
Duration of Divorce Proceedings
| Relevant Period | Observations |
|---|---|
| Initial Stability (1970-1974) | The median duration hovered around 8.5 months, showing a stable trend in the early ’70s. |
| Slight Increase (1975-1976) | A minor uptick to 9.3 months in 1976, indicating a period where divorces took longer to finalize. |
| Fluctuation (1977-1986) | The years following 1976 saw fluctuations, with durations ranging from 8.3 to 9.2 months. |
| Sharp Decline (1987-1990) | A significant drop to 5.5 months in 1987, followed by a stabilization around 5 months through 1990. |
| Stable Low (1991-2004) | A long period of stability with the median duration remaining around 5.3 to 5.4 months. |
| Minor Fluctuations (2005-2020) | Post-2004, the median duration saw minor fluctuations but generally stayed between 5.0 and 5.4 months. |
| Recent Increase (2020) | A noticeable increase to 5.8 months in 2020, possibly influenced by the COVID-19 pandemic. |
Key Observations:
- Long-Term Decline: Over the 50-year span, the median duration has generally decreased, from 8.5 months in 1970 to 5.8 months in 2020.
- Periods of Stability: There are distinct periods where the median duration remained stable, notably from 1991 to 2004.
- Impact of External Factors: The sharp decline in 1987 and the recent increase in 2020 suggest that external factors like legal changes or societal events can impact divorce durations.
Implications:
- Efficiency in Legal Process: The overall decline could indicate an increasingly efficient legal process for divorce.
- Changing Social Norms: The decrease in duration might also reflect changing societal attitudes towards divorce, making the process less contentious.
F. Seasonality of Divorce
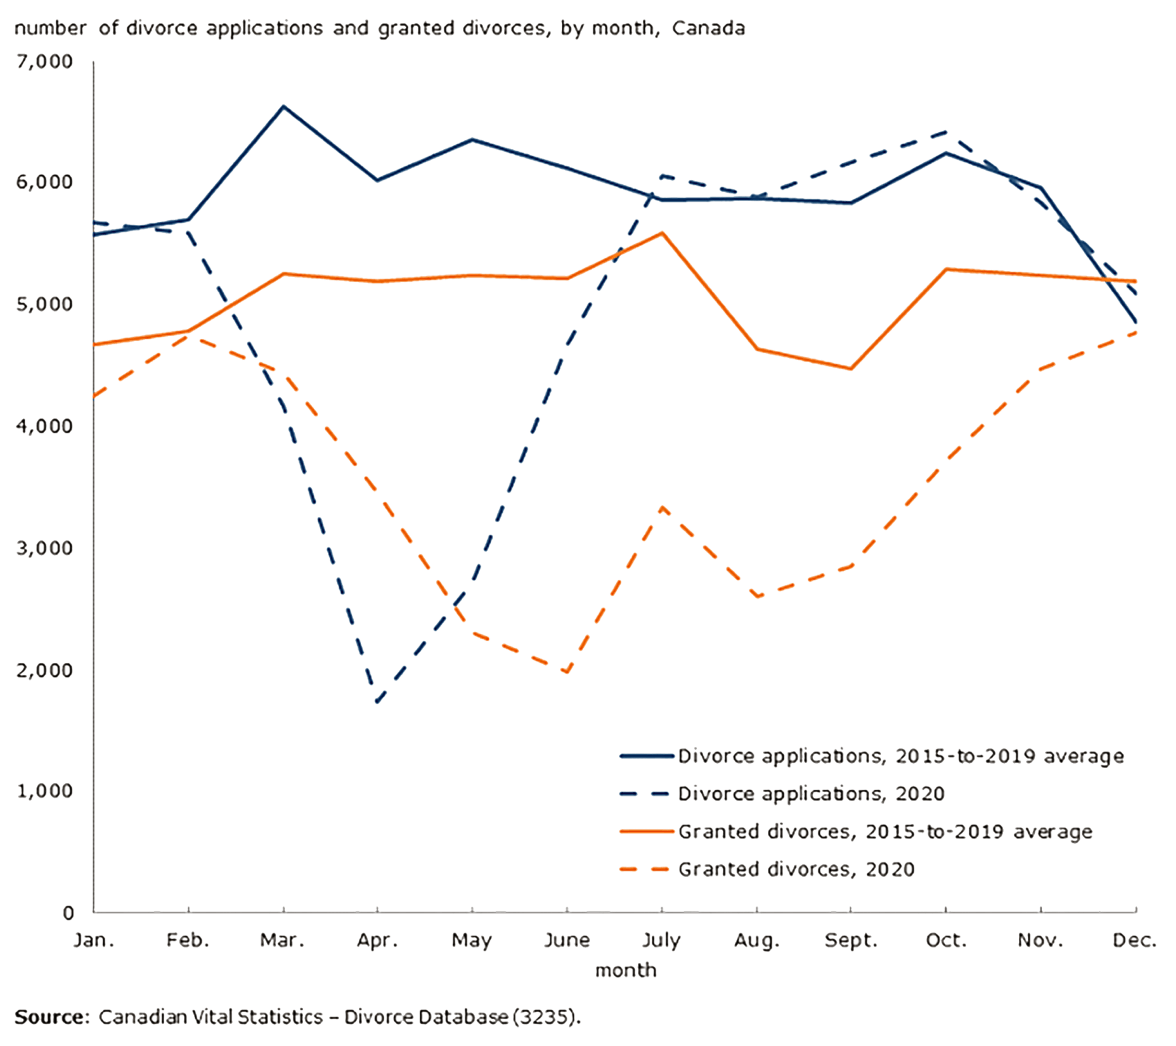
Overall Trends:
- Sharp Decline in Early Pandemic: The number of divorce applications filed with the courts saw a significant drop from 5,586 in February 2020 to 1,743 in April 2020.
- Recovery in Applications: By July 2020, the number of divorce applications had bounced back to levels similar to previous years, around 6,000 per month.
- Persistent Drop in Granted Divorces: Unlike applications, the number of divorces granted each month fell at the start of the pandemic from 4,743 in February 2020 to 1,983 in June 2020 and had not returned to pre-pandemic levels (a little over 5,000 each month) by December 2020.
Key Observations:
1. Volatility in Applications:
- Initial Hesitancy: The sharp drop in divorce applications at the onset of the pandemic may be attributed to uncertainty and fear. People were likely more focused on immediate concerns like health and job security, pushing divorce to the back burner.
- Normalization: The quick recovery in divorce applications by July 2020 suggests that the initial hesitancy was temporary. It could also imply that the stressors of the pandemic might have exacerbated existing marital issues, leading to an uptick in applications.
2. Stagnation in Granted Divorces:
- Legal Backlog: The persistent low numbers in granted divorces is likely due to a backlog in the legal system. Courts were closed or operating at limited capacity during the early months of the pandemic, which could have delayed proceedings.
- Societal Shift: Alternatively, the lower numbers could indicate a societal shift where couples might be seeking reconciliation or alternative dispute resolution methods, possibly influenced by the pandemic’s emotional and financial toll.
3. Monthly Fluctuations:
- External Factors: Monthly variations in both applications and granted divorces could be influenced by changes in divorce laws, economic conditions, or significant societal events. For example, economic downturns often correlate with a decrease in divorce rates, possibly due to the financial strain of divorce.
- Seasonal Trends: Divorce rates often show seasonal trends, usually peaking after the holidays. This pattern seemed to be disrupted by the pandemic, adding another layer of complexity to the analysis.
Implications:
- Legal System: The stagnation in granted divorces calls for an examination of the legal system’s efficiency, especially in times of crisis.
- Mental Health: The volatility in divorce applications could be an indicator of the mental and emotional stress that the pandemic has placed on relationships.
Cheryl Goldhart is a mediator and arbitrator who can make a difference in resolving your family disputes.
- Four Decades in Family Law: Cheryl offers an unparalleled depth of experience and practical wisdom in each case.
- Master’s in Counselling: Cheryl mediates family conflicts with a unique blend of empathy, understanding, and compassion.
- Certified Family Law Specialist: Recognized by the Law Society of Ontario, Cheryl’s credentials speak volumes.
- Accredited Family Mediator: Designated as an Accredited Family Mediator by the Ontario Association for Family Mediation, Cheryl is a trusted name in mediation.
- ADR Professional: Cheryl is designated as an ADR Professional by the Ontario’s ADR Institute, affirming her skills in arbitration.
- Award-Winning Dedication: Cheryl’s contributions to Family Law have earned her the prestigious Ontario Bar Association’s Award For Excellence.
Legal Disclaimer: See Privacy Policy